After running a simulation, PetroBench displays the full results summary - design evaluation, calculated values, dynamometer cards, rod stress data, loading charts, and a 3D wellbore view.
Design Evaluation
The design evaluation panel runs four checks automatically and flags anything outside acceptable limits.
Rod Loading: compares peak stress in each taper against the allowable stress for that rod grade. If any section exceeds 100% of allowable, the evaluation flags it red.
Buckling: identifies rod sections where compressive loads during the downstroke exceed the critical buckling threshold. Common in deviated wells and heavy-oil applications.
Gearbox Loading: calculates peak torque and compares it against the unit's rated gearbox capacity. Values above 80% deserve attention; above 100% means the unit is undersized for this design.
Structural Loading: checks the beam and Samson post loads against the pumping unit's structural rating. If the simulation output exceeds the unit's capacity, consider reducing stroke length, slowing pump speed, or selecting a larger unit.
Green means within limits. Yellow means approaching the threshold. Red means the design needs revision before installing.
Calculated Results
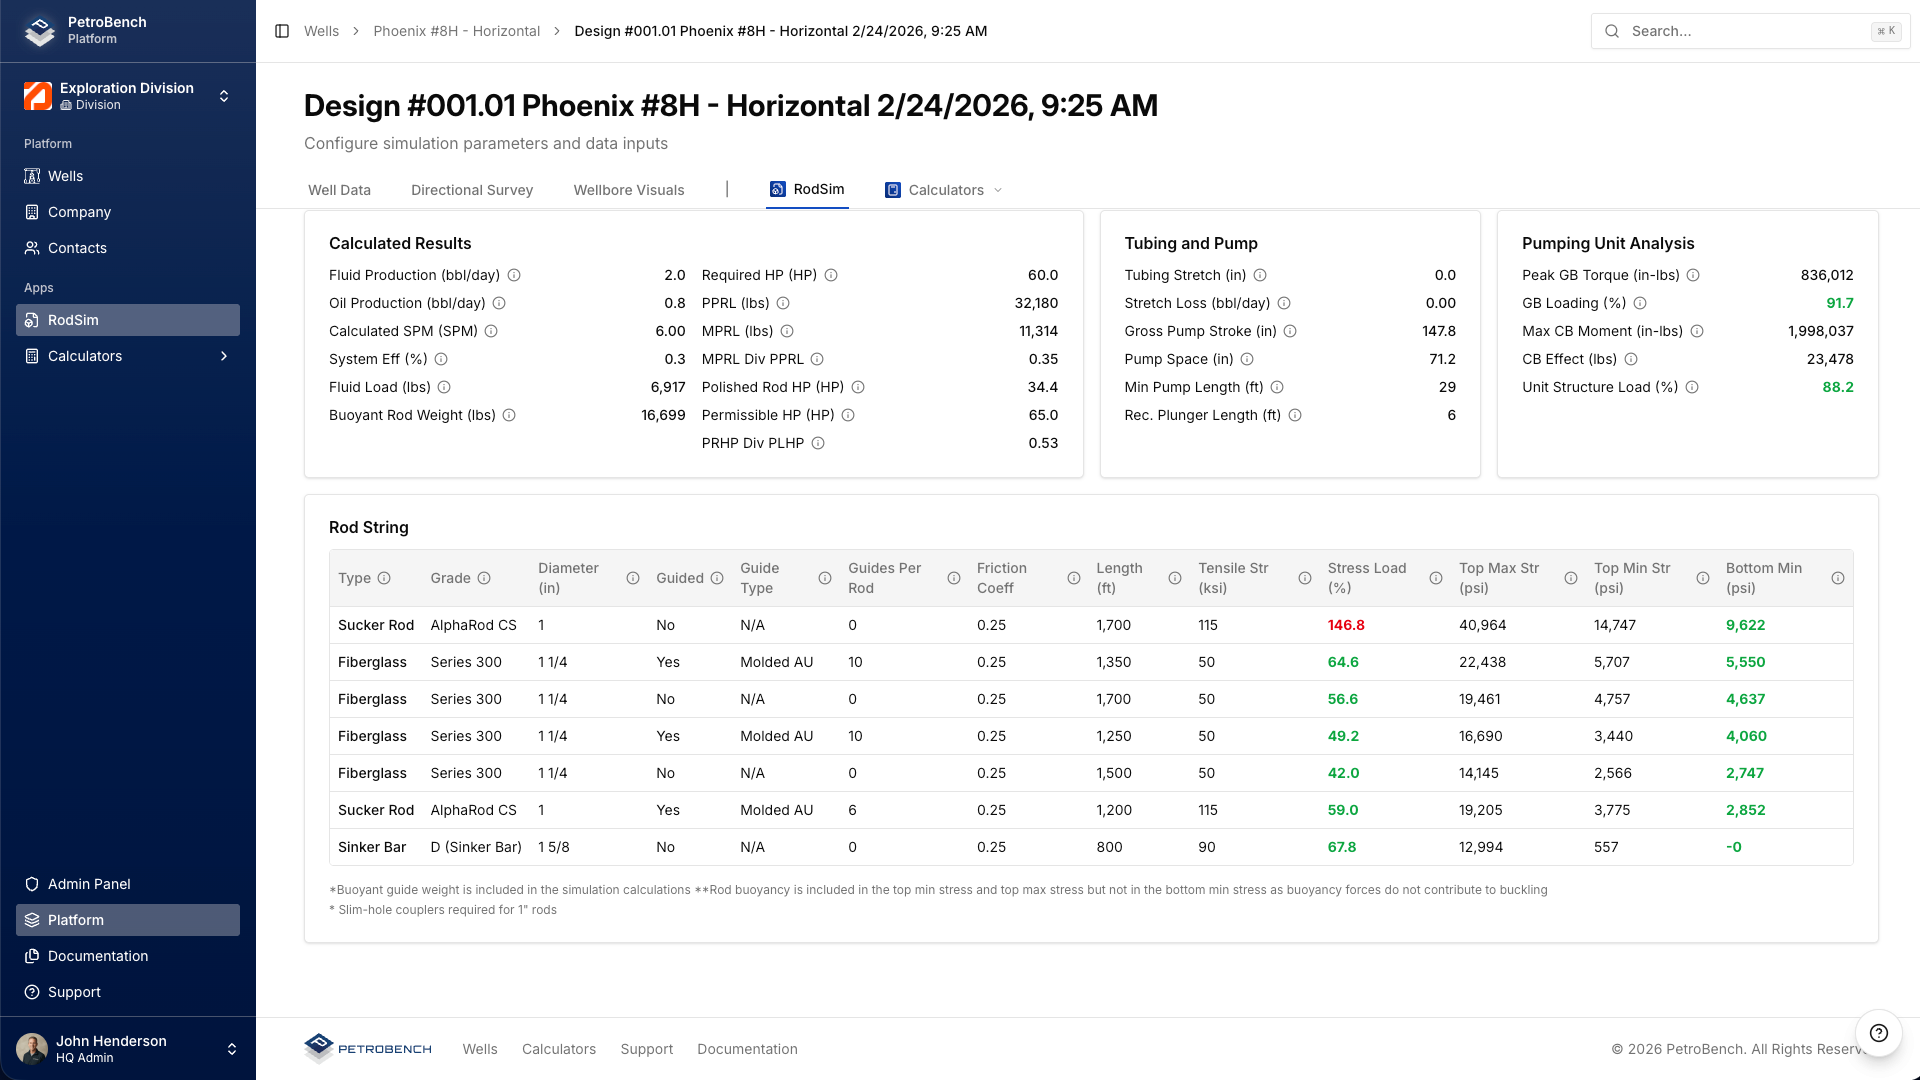
The calculated results card displays the core simulation output. These are the numbers you'll reference most when evaluating a design.
PPRL: peak polished rod load in lbs. This is the maximum upward force at the top of the upstroke. Compare it against the unit's structural capacity to confirm the design is within limits.
MPRL: minimum polished rod load in lbs. Occurs near the bottom of the downstroke. If MPRL goes negative, the rod string is going into compression at the surface, which typically means the counterbalance needs adjustment.
Production Rate: predicted fluid volume in bbl/day, calculated from pump displacement, fillage, and slippage losses. This is the theoretical maximum assuming the reservoir can deliver sufficient inflow.
System Efficiency: the ratio of hydraulic horsepower (lifting fluid) to the total input power at the motor. Typical values range from 30% to 60% depending on well depth, deviation, and rod string design.
Pump Displacement: the theoretical volume swept by the plunger per stroke in bbl/day, before accounting for slippage or gas interference. The difference between pump displacement and production rate tells you how much volume you're losing.
Dynamometer Cards
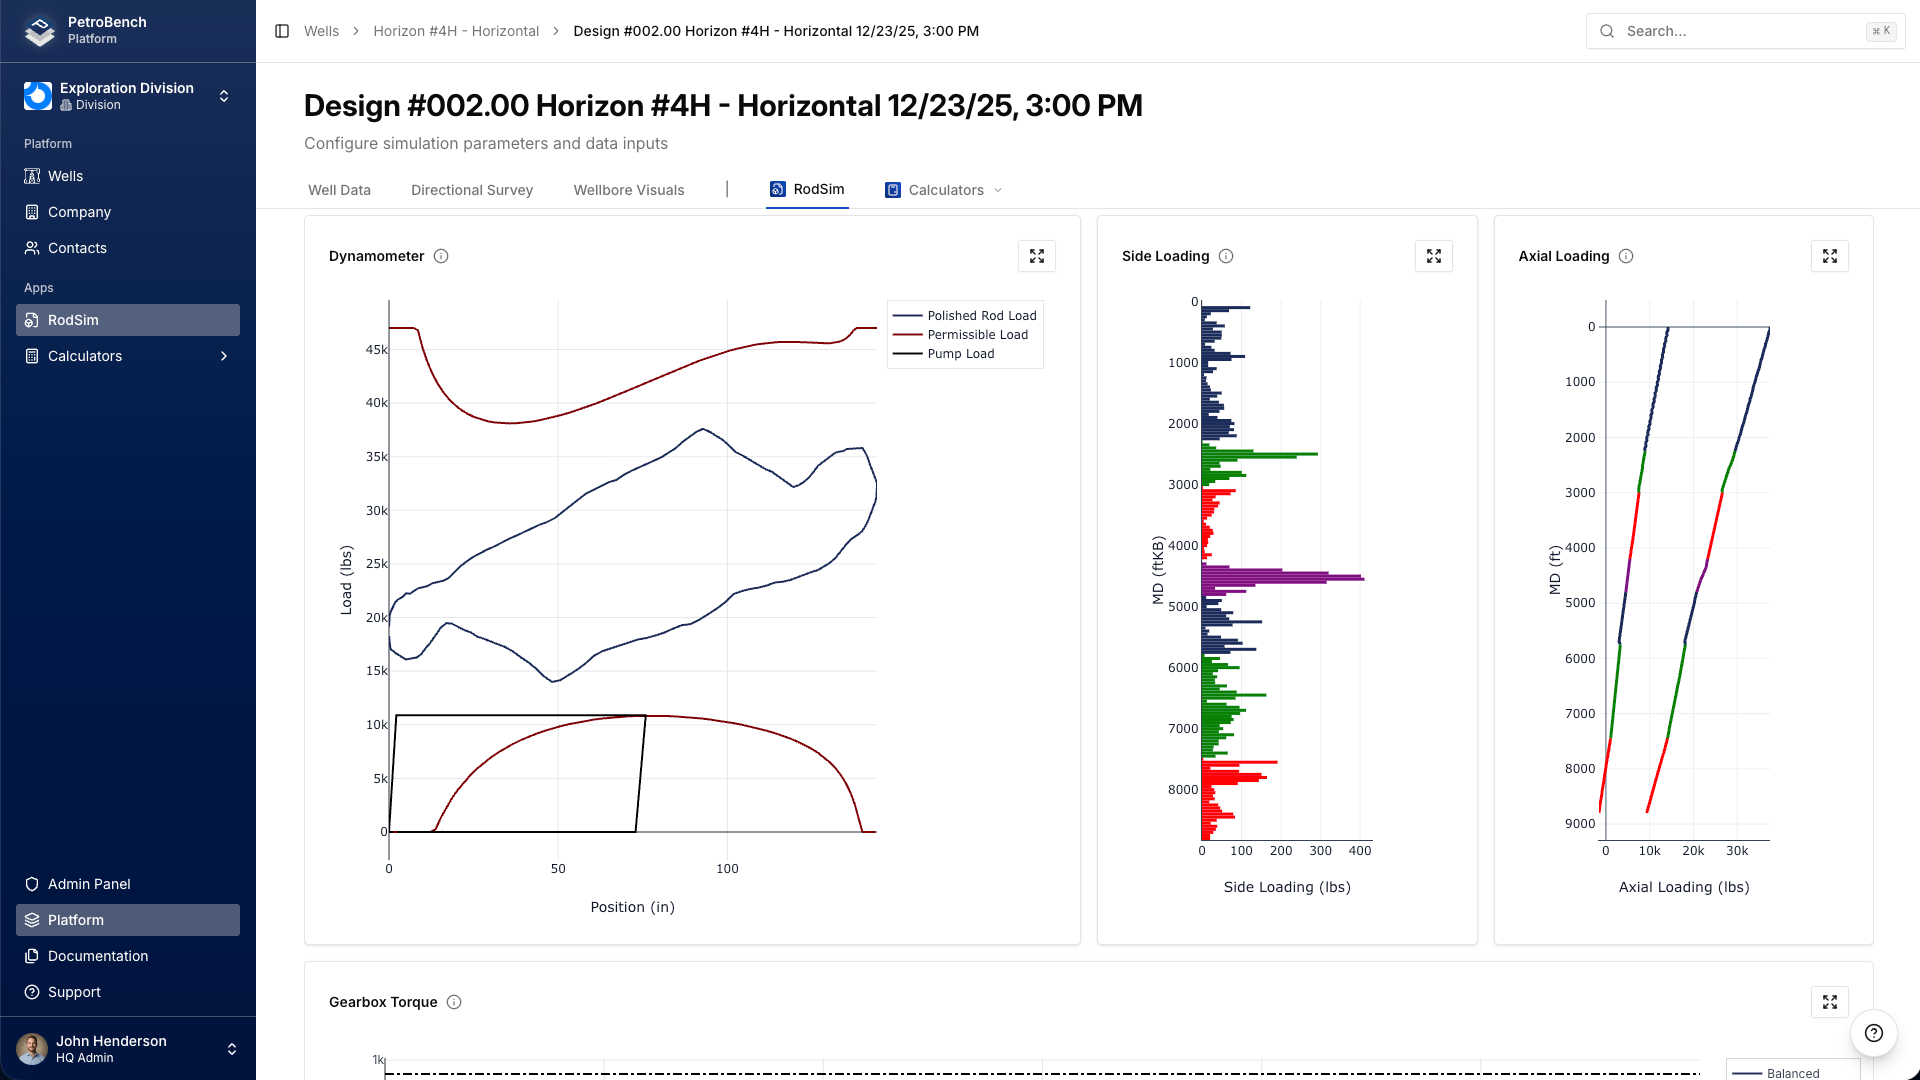
PetroBench generates two dynamometer cards from every simulation: the surface card and the downhole pump card.
The surface card plots polished rod load (vertical axis) against polished rod position (horizontal axis) for one complete pump cycle. A healthy design produces a roughly parallelogram-shaped card. Distortions indicate specific problems - a pinched top-right corner suggests gas interference, a tapered right side indicates incomplete fillage, and sharp load reversals point to mechanical friction or tubing anchor issues.
The downhole pump card is computed from the surface card using the wave equation, removing the elastic behavior of the rod string. An ideal pump card is a clean rectangle. The top edge represents the fluid load on the plunger, the bottom edge represents the rod weight below the plunger, and the vertical sides represent the traveling and standing valve events. Deviations from this rectangle map directly to downhole conditions.
Rod String Summary
The rod string summary breaks down stress values for each taper section. For each rod size and grade, PetroBench reports peak stress, minimum stress, and the percentage of allowable stress consumed.
The Goodman diagram plots each taper's stress range against the modified Goodman line for its rod grade. Points that fall below the line are within the fatigue endurance limit. Points above the line indicate the rod section will eventually fail from cyclic fatigue, regardless of how strong the material is in static loading. This is the single most important check for long-term rod life.
If a taper exceeds the Goodman line, consider upgrading to a higher-grade rod (D to K, or K to C), increasing the rod diameter, or adding a taper section to redistribute the load.
Side Loading and Axial Loading
In deviated wells, the rod string contacts the tubing at bend points along the wellbore. The side loading chart plots lateral force per unit length (lbs/ft) against measured depth, showing exactly where the rods press against the tubing wall.
High side loads accelerate tubing and rod wear. If the simulation shows concentrated side loads above 50-100 lbs/ft at specific depth intervals, those are the locations where you'll see failures first. Rod guides or centralizers at those depths can reduce contact pressure and extend run life.
The axial loading chart shows tensile and compressive forces along the rod string during both the upstroke and downstroke. Sections that go into compression during the downstroke are susceptible to buckling, which is a primary cause of rod failures in deviated wells.
3D Wellbore Visualization
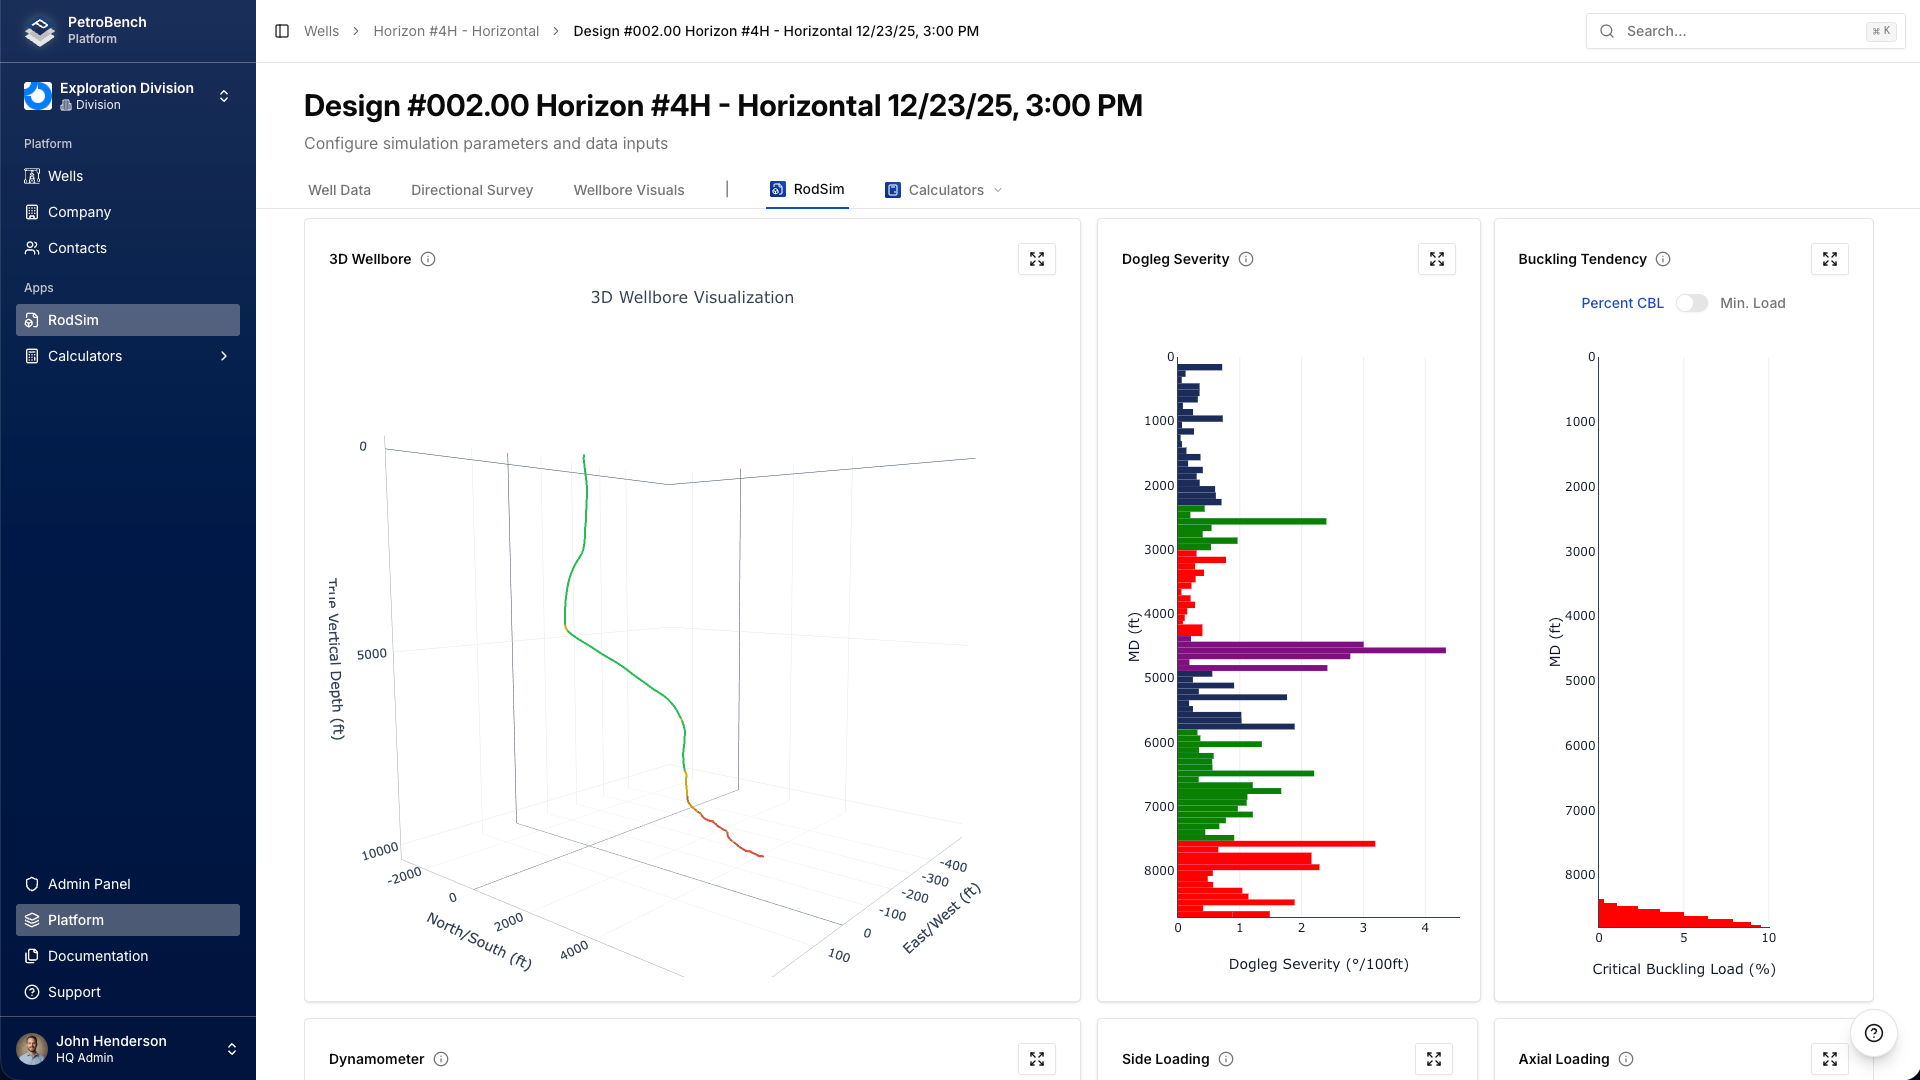
The 3D view renders the wellbore trajectory with the rod string positioned inside the tubing. Rotate and zoom to inspect the full well path from surface to pump. Color gradients along the rod string indicate stress intensity or side load magnitude, depending on the selected overlay.
This view is especially useful for identifying where dogleg severity changes correlate with high side loads. It's also the clearest way to communicate wellbore-specific concerns to field teams who may not interpret 2D charts as quickly.
Exporting Results
Click Export PDF to generate a formatted report containing all simulation results, charts, and design parameters. The PDF is suitable for filing, peer review, or attaching to an AFE.
To compare multiple designs, open the comparison view. Select up to five saved simulations and PetroBench displays their key parameters side by side - PPRL, MPRL, production rate, rod stress percentages, and gearbox loading. This makes it straightforward to evaluate how changing rod grade, taper design, or pump speed affects the overall system.